Building a family tree
I have been not-so-recently tasked with the job of putting together my family's family tree. It has occurred to me that other people might want to give the task a try, so here is my experience as a programmer.
First steps
The first important step was collecting my family information. I did this the old-fashioned way, sitting down with my mom and writing down in a spreadsheet names and relations. We didn't go beyond "married to" and "son/daughter of" because it was not important for us, but you could extend this information with birthdays, marriage dates, and so on.
The spreadsheet was good for collecting data fast, but getting the graph done required better tools: like all good programmers I'm lazy, and I'm not going to sit down and hand-place over 100 nodes if I can avoid it. I therefore turned to Gramps, an open-source software for Genealogical research. This software offers a lot of functionality and may seem daunting at times, but fear not: the software is clearly done by people who understand the problem very well, and it lets you record as much or as little information as you want. My favorite example: you can add a person with no name and no birth date, and the software will not even complain. I think it also auto-fills a person's gender based on their name.
Gramps has plenty of visualization options, and if you're not a software developer you can use one of them and stop reading here. Luckily I am a software developer, and un-luckily I couldn't find any visualization that did what I wanted. I was looking for a compact graph that I could fit in an A4 page, but all I could generate in Gramps' GUI were trees with very generous white space between nodes. This is in no way a point against Gramps, by the way: no software package can be everything for everyone, and I don't think I've ever had a graphic design project that I didn't need to hand-tweak one way or another. But one way or another, it was now time for massaging some data.
Tweaking the graph
After exporting the Gramps database to a CSV file, I decided to use Graphviz for automatic node placement. Graphviz is my go-to tool for drawing complex graphs, and I knew it could get the job done, but first I would have to convert my CSV file to Graphviz' DOT format. So I wrote the following script, which generates a DOT version of the input file.
#!/usr/bin/python3

import csv

# Counter with my own internal IDs, for fake nodes
counter = 1000
# Maps people to their intermediate relation nodes
relation = dict()
# Maps between Gramps IDs and my own internal ones
old2new = dict()

print("digraph G {")

# This CSV file should contain the following columns:
# 1: Name, 2: Last name, 4: Father ID, 5: Mother ID, 6: Partner
# A default Gramps export should be already structured like this.
with open('gramps_database.csv') as csvfile:
    datareader = csv.reader(csvfile)
    for row in datareader:
        id = row[0]
        # By default, you are in a relation with yourself
        # Useful for single parents
        relation[id] = counter
        counter += 1
        name = row[1] + " " + row[2]
        parents = None
        partner = None
        if row[4]:
            father = row[4]
            parents = relation[father]
        if row[5]:
            mother = row[5]
            parents = relation[mother]
        if row[6]:
            partner = row[6]
            if partner not in relation:
                relation[partner] = relation[id]
            else:
                relation[id] = relation[partner]
        # Note that we have all information we need for this person,
        # we are not dependent on a future iteration.
        # Therefore, we can print this section of the tree.
        # First, the name
        print("{}[label=\"{}\"];".format(id,name))
        # Now, relations
        if parents is not None:
            print("{} -> {};".format(id, parents))
        if partner is not None:
            print("{} -> {} [dir=none];".format(id, relation[partner]))
print("}")
I then fed this output (tree.dot) to Graphviz. After playing with
different visualization options, I settled for the following options:
sfdp -Tpdf -Gsplines=true -Goverlap=false tree.dot -o tree_output.pdf
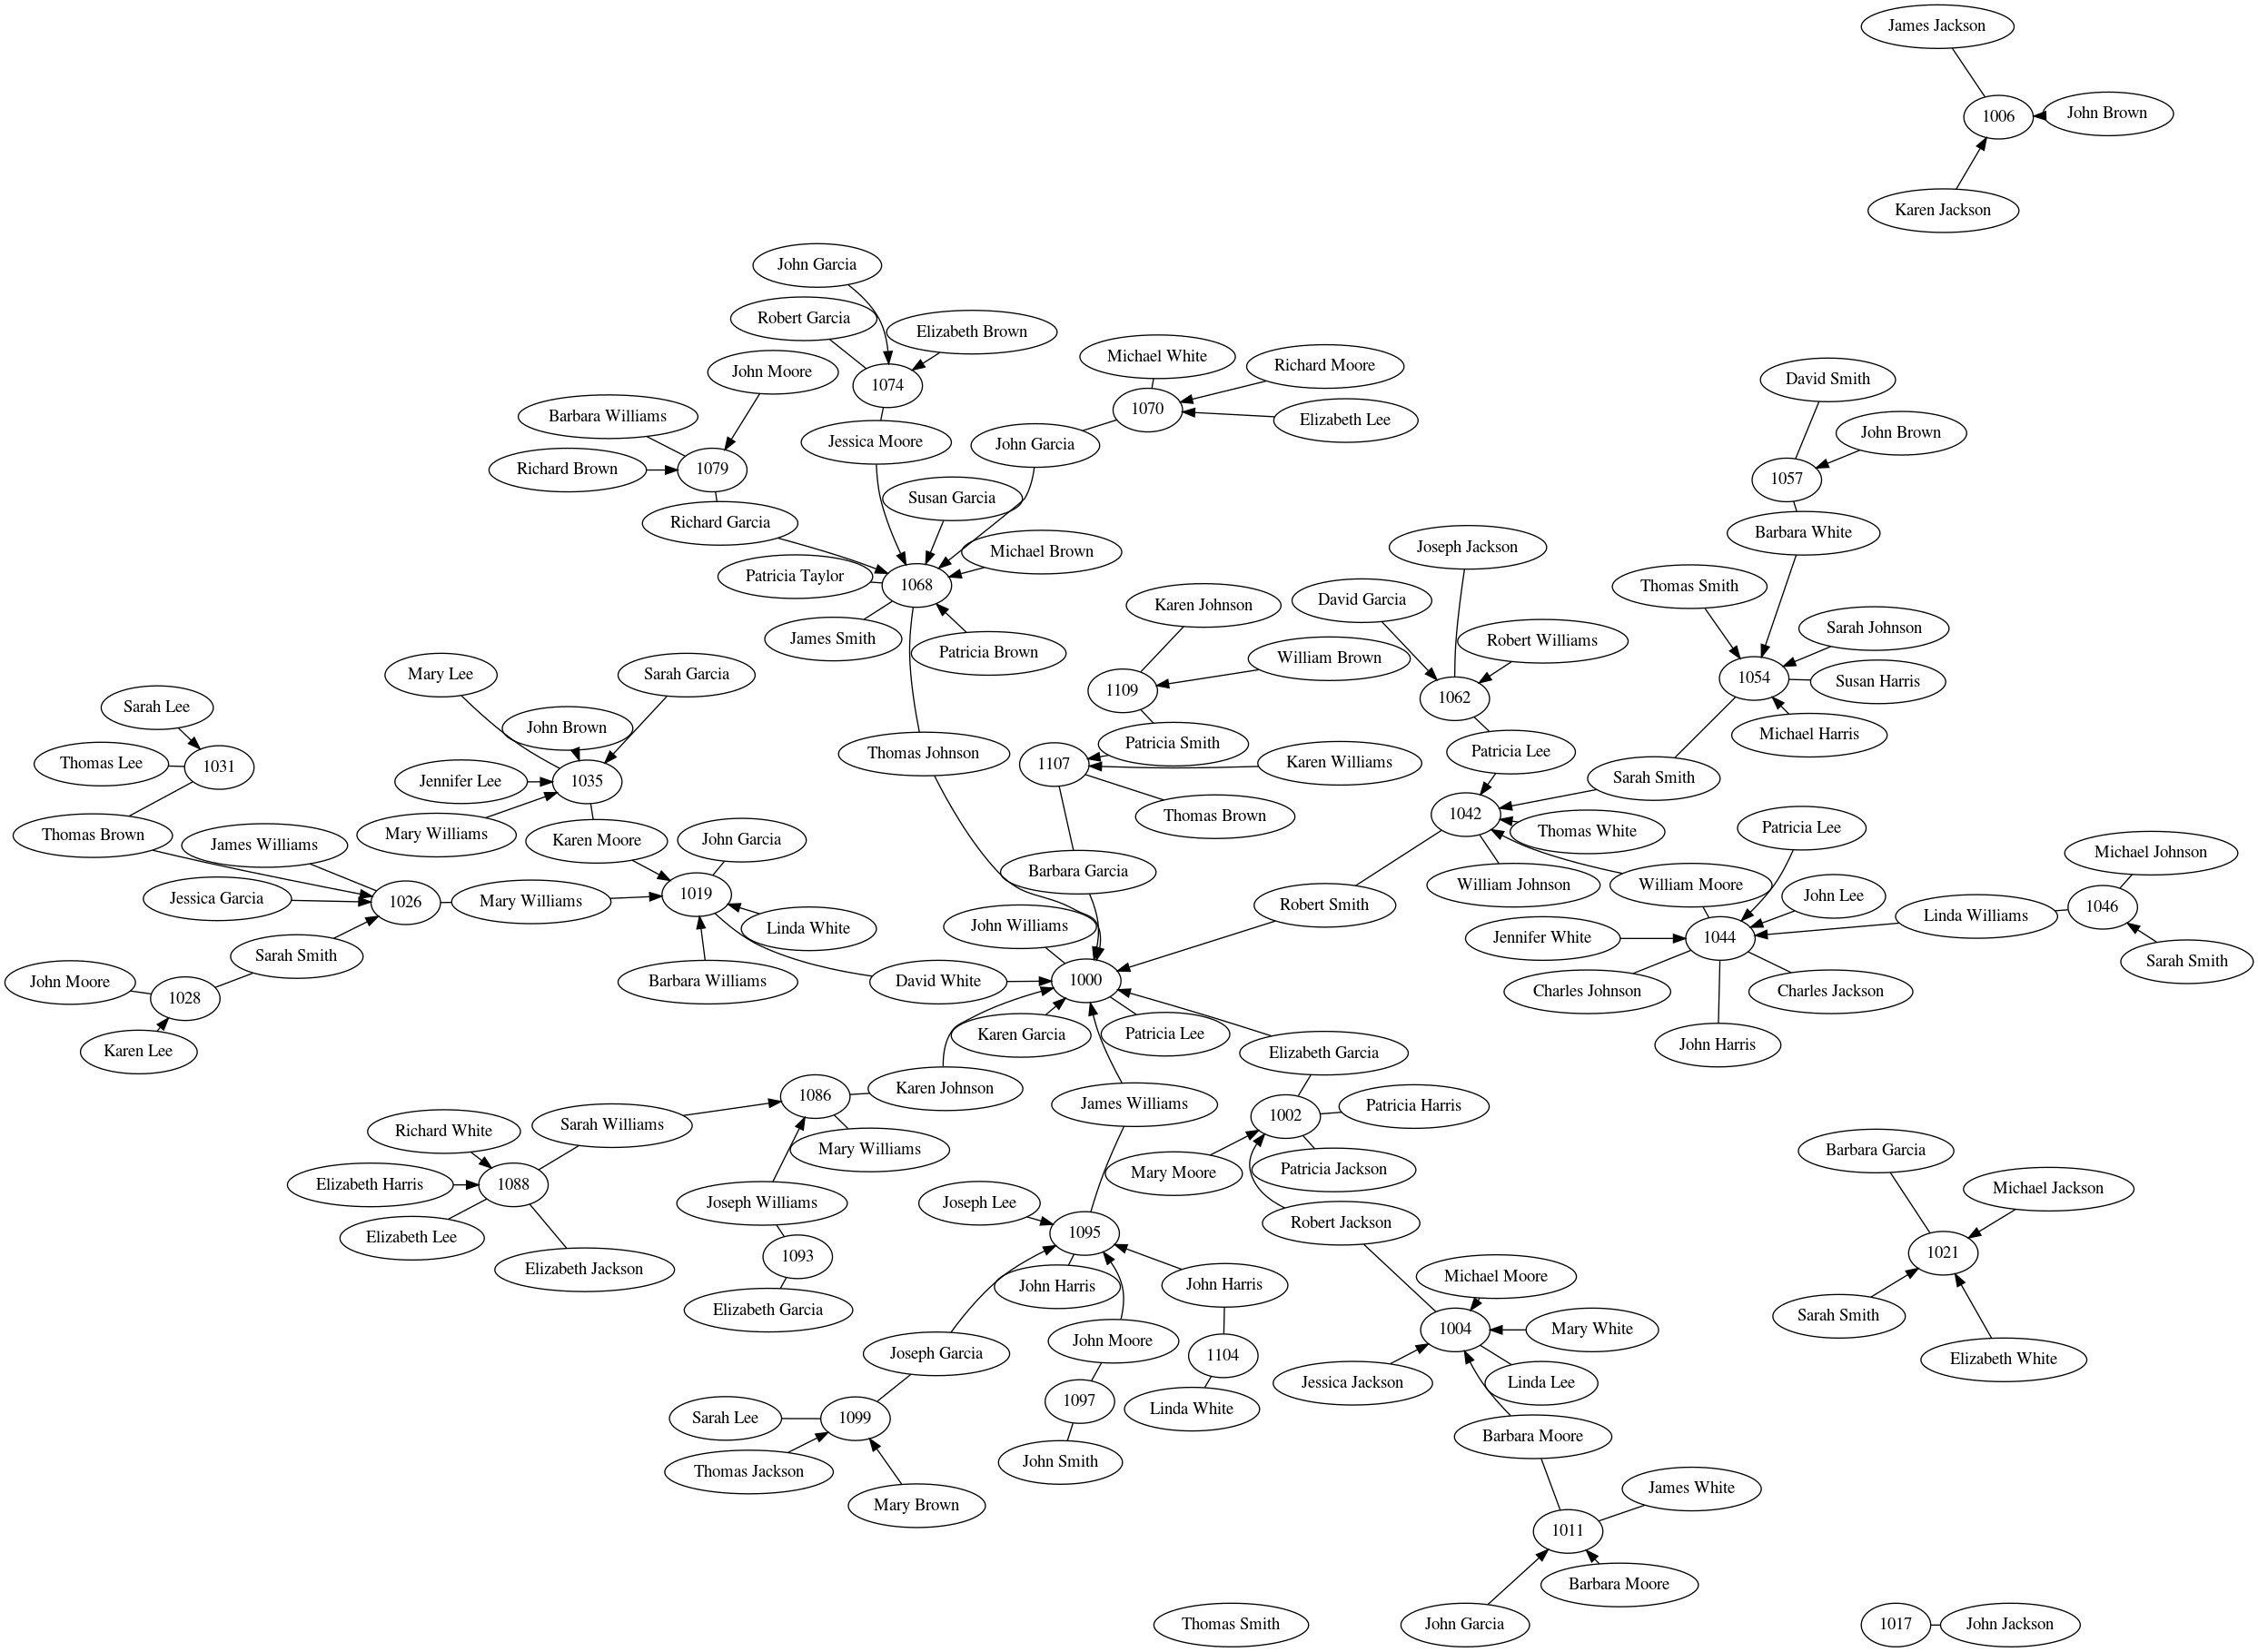
which ended up looking like this:

This is still not perfect, but it's 85% there and it's something I can easily work with. I imported this graph into Inkscape, moved nodes around until they fit as tightly as I wanted, and added some colors.
Border
One of my known weaknesses is that I'm very picky on the graphic design of my projects: why stop at doing something right, when you can do it right and good looking? For this reason, I am constantly collecting pictures of cool posters, certificates, book covers, t-shirts, and pretty much everything that can be designed for print. You never know when something might come useful as inspiration!
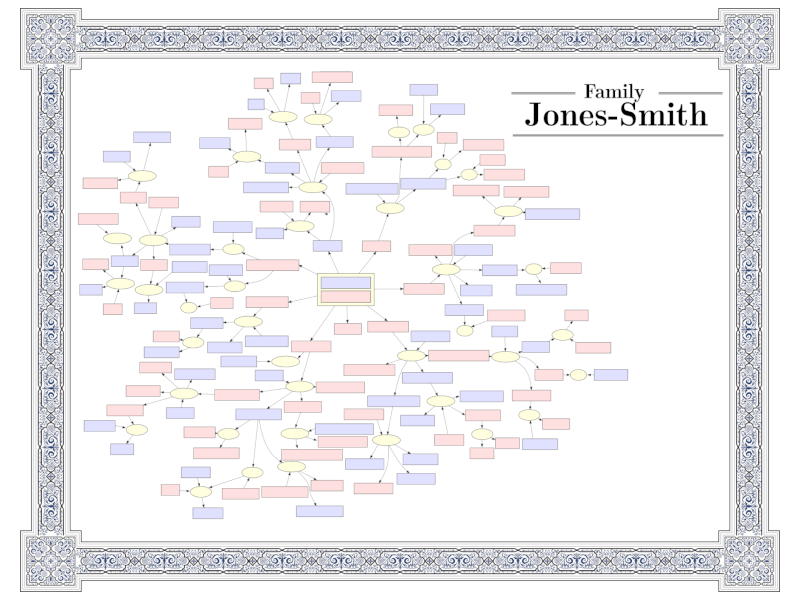
Interesting enough, my collection of museum family trees was not as helpful as I expected: while very nice to look at, I found most trees difficult to understand, too simple, or too much illustration and not enough content (most artists are really invested into the "tree" metaphor). What did help me, however, was my collection of old-fashioned documents: the border of this tree is based on a 1923 Share Certificate from the "Charlottenburger Wasser- und Industriewerke AG", as seen in Berlin's Museum in Alten Wasserwerk.
Using it as a template, I created a vector version in Inkscape and placed it around my tree, which gives it a nicer "feel" and leads us to this version (with names removed intentionally):

The space on the right was originally reserved for legends, references, and whatever else, but so far I haven't come up with anything. And of course, I also need some space for future family members.
Final steps
The final step was to share it with my family, which was done with a combination of e-mail and telephone calls. About once a month I get a list of corrections from family members, which I do directly in Inkscape because at this point it's faster. I still keep the Gramps database updated, though, as I never know which future projects might require it.
The final tree can be printed in A4, as desired, but I wouldn't recommend anything smaller than A3. As a service for my readers, and painfully aware of how difficult it is to find good frames, you can download the empty template in .SVG format following this link to use in your own projects.
