Animations in Gephi
Gephi is a tool for graph visualization that's great for plotting big datasets. If you have large, complex graphs to plot, Gephi has plenty of layouts that you can apply to your data and turn a mess of a graph into something that hopefully makes sense.
But there's something Gephi can't do: animations. The layout algorithms at work look awesome, and yet there's no easy way to create a video out of them. Capturing the screen is an alternative, but the final resolution is not really high.
It has been suggested that you could export images of the individual networks at every step and then put them together. Of course, the people who suggested this in the past have also...
- ... sworn that they have scripts to do it,
- ... promised that they'll release them after a quick cleanup, and
- ... disappeared from the internet without having published their solutions.
Therefore, this post.
Note: this post is not an introduction to Gephi, and I'll assume that you know the basics. If you don't know them, these slides look quite good.
Requirements
- Gephi (obviously)
- ImageMagick (to post-process images in bulk)
- FFmpeg (to create the final video)
I am also assuming that you are using Linux. This is not a requirement, but it does make my life easier.
Preparing your data
The first step is to have some data to visualize. For the purposes of this
exercise, you can download this zip file
containing two files named nodes.csv and edges.csv. They form a simple
directed graph that I generated from a sample of directories in my computer.
Now, load them into Gephi:
- Start a new Project
- Load the nodes table:
File → Import spreadsheet → nodes.csv. Follow the steps, but remember to select "Append to existing workspace" in the last one. - Repeat the previous step, this time using the
edges.csvfile.
Next, choose a layout. In my experience it is better to try them all first, see which one gives the best result, and then generate the final graph from scratch. Generating the final graph will take a while, so it's better to do it only once you are sure about which parameters to use.
Exporting all frames
It is now time to run our first script. If you don't have the
Scripting Plugin
installed, you can do it now via Tools → Plugins. We will use it to
write a very simple Python script that does the following:
- Run a single step of a layout
- Take note of the relative size of the graph (we'll come back to this)
- Export it to a PNG file
- Return to step 1.
In case you want to copy-paste it, this is the script I used. Don't forget to remove the comments first, because Gephi doesn't like them.
def make_frames(iters, layout, outdir):
    # As many iterations as frames we want to generate
    for i in range(iters):
        # Run a single step of our layout
        runLayout(layout, iters=1)
        # Calculate the bounding box of this specific graph
        min_x = 0
        max_x = 0
        min_y = 0
        max_y = 0
        for node in g.nodes:
            min_x = min(min_x, node.x)
            max_x = max(max_x, node.x)
            min_y = min(min_y, node.y)
            max_y = max(max_y, node.y)
        width = max_x - min_x
        height = max_y - min_y
        # Generate a file and include the graph's bounding box
        # information in its filename
        exportGraph("%s/%05d-%d-%d.png" % (outdir, i, width, height))
Once you have copied this script into the console, you can generate all
animation frames with the command make_frames(100, FruchtermanReingold, "/tmp/").
This will run the FruchtermanReingold layout for 100 iterations, and will save
the generated frames in the /tmp/ directory. Of course, you can choose other
layouts (see the documentation
for more info) and you can run the script for a larger number of steps.
You can also customize the layout parameters in the regular Layout tab, and
the script will pick them up.
The script will block Gephi entirely, so don't go for a really high
number of steps from the beginning. Start with 50-100, and only then move on.
For a nicer effect, make a single run of the "Random" algorithm first.
This will put all your nodes in a very small space, and the final effect will
be like an explosion of nodes.
Generating the animation
A further issue to deal with is the changing size of the image canvas. If we set Gephi to generate a 1024x1024 output image but we only have two nodes close to each other, those two nodes will look huge. If we have thousands of disperse nodes, however, the individual nodes will be barely visible. Therefore, if you made a video with the images we generated in the previous section directly, you would almost certainly get a zoom effect where the nodes would get bigger and smaller as the graph gets denser or sparser respectively.
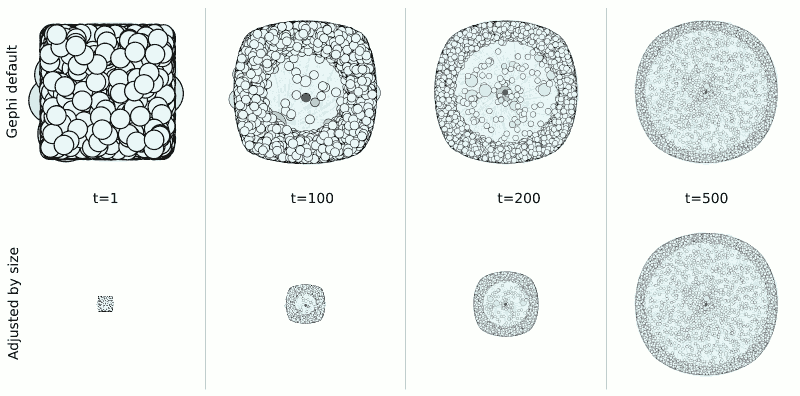
To avoid this, we need to scale all pictures proportionally.
The Bash script below calculates the maximum theoretical size of our graph
(based on those variables we added to the filenames before), scales all images
down to the proper size (as defined by canvas_w and canvas_h), and places
them in the center of a single-color canvas (see the rgb() call).
# Directory where all individual frames are
SOURCE_DIR=/tmp
# Directory where final frames will be stored
TARGET_DIR=/tmp/outdir

# Obtain the theoretical maximum width and height in the PNG frames
max_width=`ls ${SOURCE_DIR}/*png | cut -f 2 -d '-' | sort -n | tail -1`
max_height=`ls ${SOURCE_DIR}/*png | cut -f 3 -d '-' | cut -f 1 -d '.' | sort -n | tail -1`

# Give your desired canvas size
canvas_w=1024
canvas_h=1024

# Scaling factor for the frames, based on the largest theoretical dimension
if (( $max_width > $max_height ))
then
    factor=`bc -l <<< "$canvas_w/$max_width"`
else
    factor=`bc -l <<< "$canvas_h/$max_height"`
fi

# Generate the new frames
for file in ${SOURCE_DIR}/*png
do
    # Obtain the properties of the image
    frame=`echo $file | xargs -n 1 basename | cut -f 1 -d '-'`
    width=`echo $file | cut -f 2 -d '-'`
    height=`echo $file | cut -f 3 -d '-' | cut -f 1 -d '.'`
    # Calculate how the image should be scaled down
    new_width=`bc -l <<< "scale=0; ($width*$factor)/1"`
    new_height=`bc -l <<< "scale=0; ($height*$factor)/1"`
    # Put it all together
    convert $file -scale ${new_width}x${new_height} png:- | \
        convert - -gravity Center -background "rgb(255,255,255)" \
        -auto-orient -extent ${canvas_w}x${canvas_h} \
        ${TARGET_DIR}/${frame}.png
done
Once you have generated this second set of frames, you can generate your final
video going to your TARGET_DIR directory and running the command
ffmpeg -framerate 30 -i %05d.png -c:v libx265 -r 24 final_video.mp4
If your video is too slow, a higher framerate value will do the trick (and
vice versa). The final result, heavily compressed for the internet, can be
seen below:
Final thoughts
I hope you'll find this guide useful. I'm not going to say that it's easy to follow all these steps, but at least you can set them up once and forget about it.
Some final points:
- For an alternative method of graph generation involving nodes with timestamps, this script looks like the way to go.
- I'm interested in unifying everything under a single script - I chose Python because it was easier than Java, but maybe developing a proper multi-platform plugin is the way to go. I can't promise I'll do it, but I'll think about it. In that same vein, perhaps the script should center in a specific node?
- If you plan to publish your video on the internet by yourself, this post gives a nice overview of which standards to use. If you want to tweak the video quality, this SE question provides some magic incantations for FFmpeg.
- Finally, and speaking of magic incantations, special thanks to this post for providing the right ImageMagick parameters.
